K-means is an unsupervised learning algorithm (shoutout to types of ML blog) that iteratively clusters unlabeled data samples together by similarity. K represents the final number of clusters, which must be specified as an input parameter before the algorithm can work. Means refers to the center of the cluster, or the centroid, which is the mean value of the data samples in that cluster. The goal of this algorithm when used for machine learning tasks is to uncover hidden patterns in the unlabeled data.
Here’s the rundown for how it works:
After the number of clusters k is chosen, the algorithm selects k initial centroids at random. Then, the distance between every sample and each centroid is calculated (usually using Euclidean distance). Here’s the iterative part: Each point is assigned to the cluster of the centroid it is nearest to. The algorithm then re-calculates the centroid of each cluster based on the mean value of the samples in that cluster. This is repeated until all of the clusters are stable.
You might be wondering: how do I choose k though? Really good question, thanks. I’m not going to get into it too much right now, though I might come back to edit this in the future, but the point is that, like with any ML algorithm, we want to minimize the loss function, which in this case is the Sum of Squares Error (SSE). It has been found that as k, or the number of clusters, increases, the loss function decreases, so we want to find a k after which the loss stops significantly improving. In other words, the point at which adding more clusters doesn’t help the loss function anymore. A popular, though not necessarily the best, way to do this is using the elbow method which plots k against the loss function and the “elbow” point of the arm-looking line graph is the optimal k after which the loss function value plateaus. Anyways…
K-means for color extraction
I actually mainly wrote this brief exploration of k-means because I made a little Python notebook that generates bead patterns for bead weaving based on an uploaded image. To extract the main colors from a given image, I used Kmeans from scikit-learn. After converting the image to RGB format (Red, Green, Blue, with a scale from 0 to 255 representing the intensity of each color) and flattening the grid of pixels into a list of pixels, the k-means algorithm comes in. In this scenario, the number of colors we want in the final pattern is the k we choose. Essentially, we are making clusters of pixels based on the main colors in our image and returning the centroids of each of those clusters as the final colors for the beads used in the pattern.
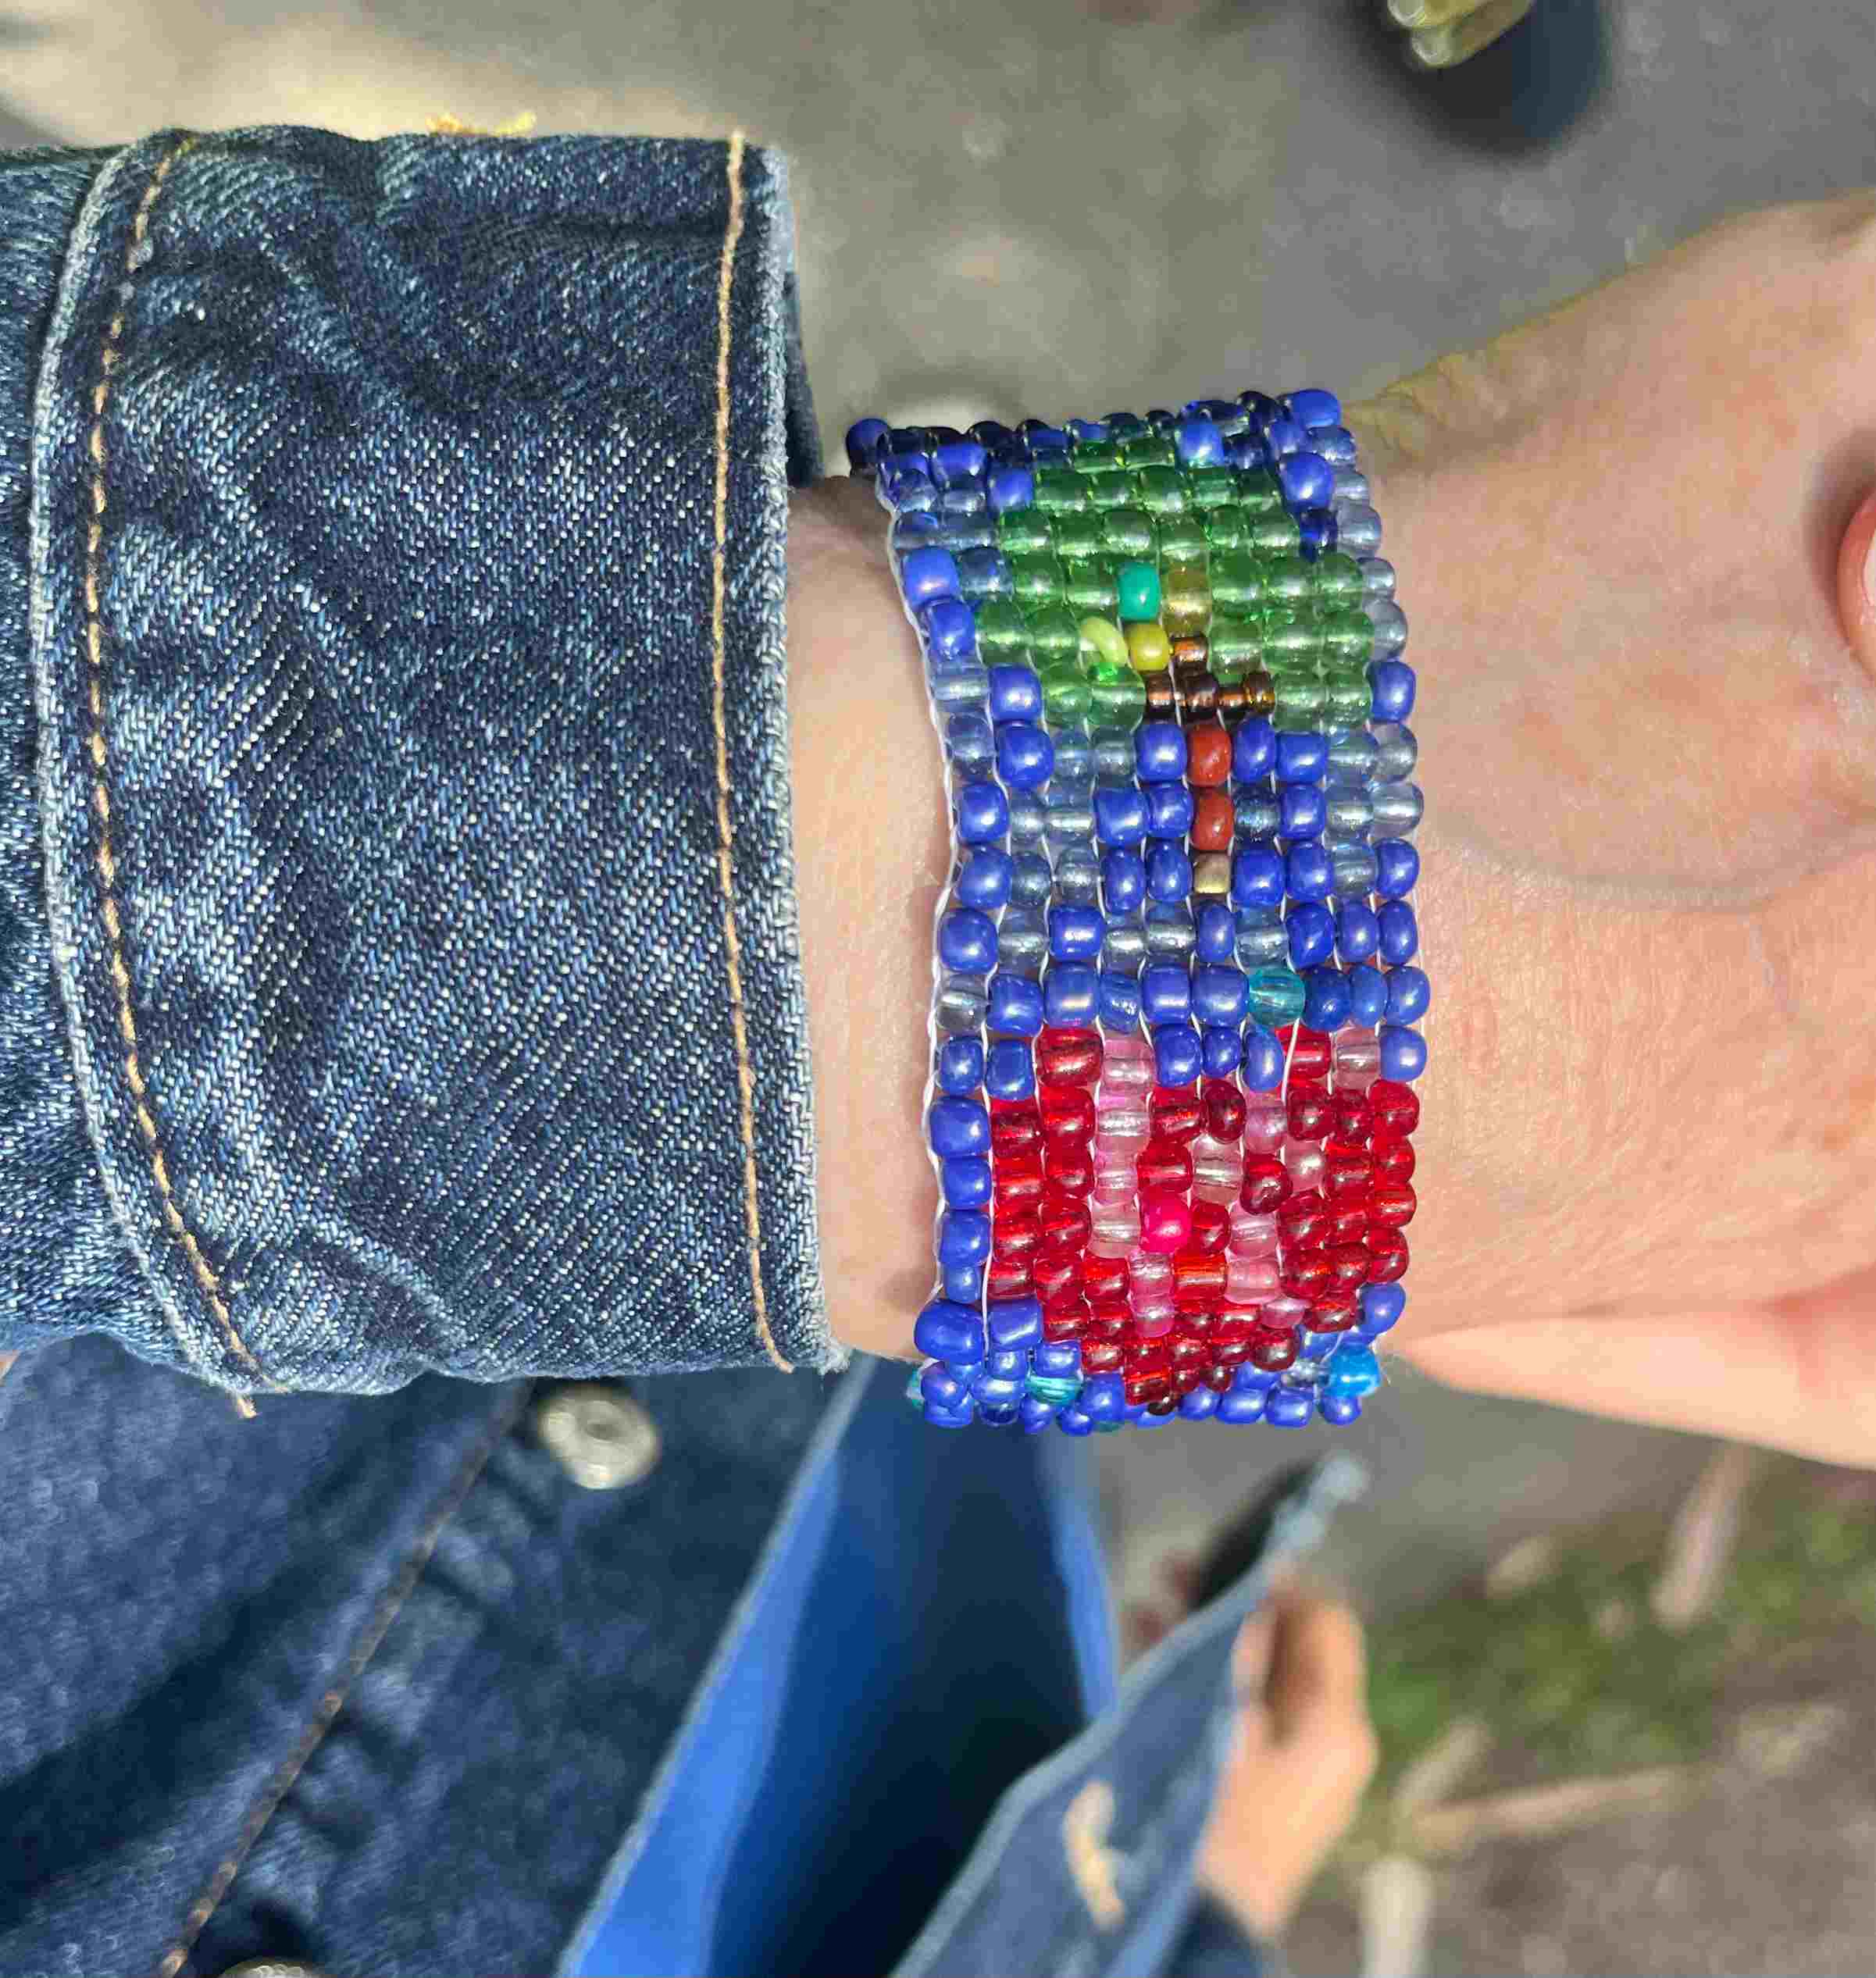
Here is part of the bracelet I made based on the patterns the code generated for a simple tree and heart:
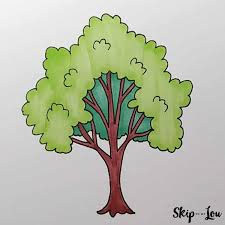


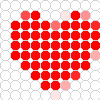
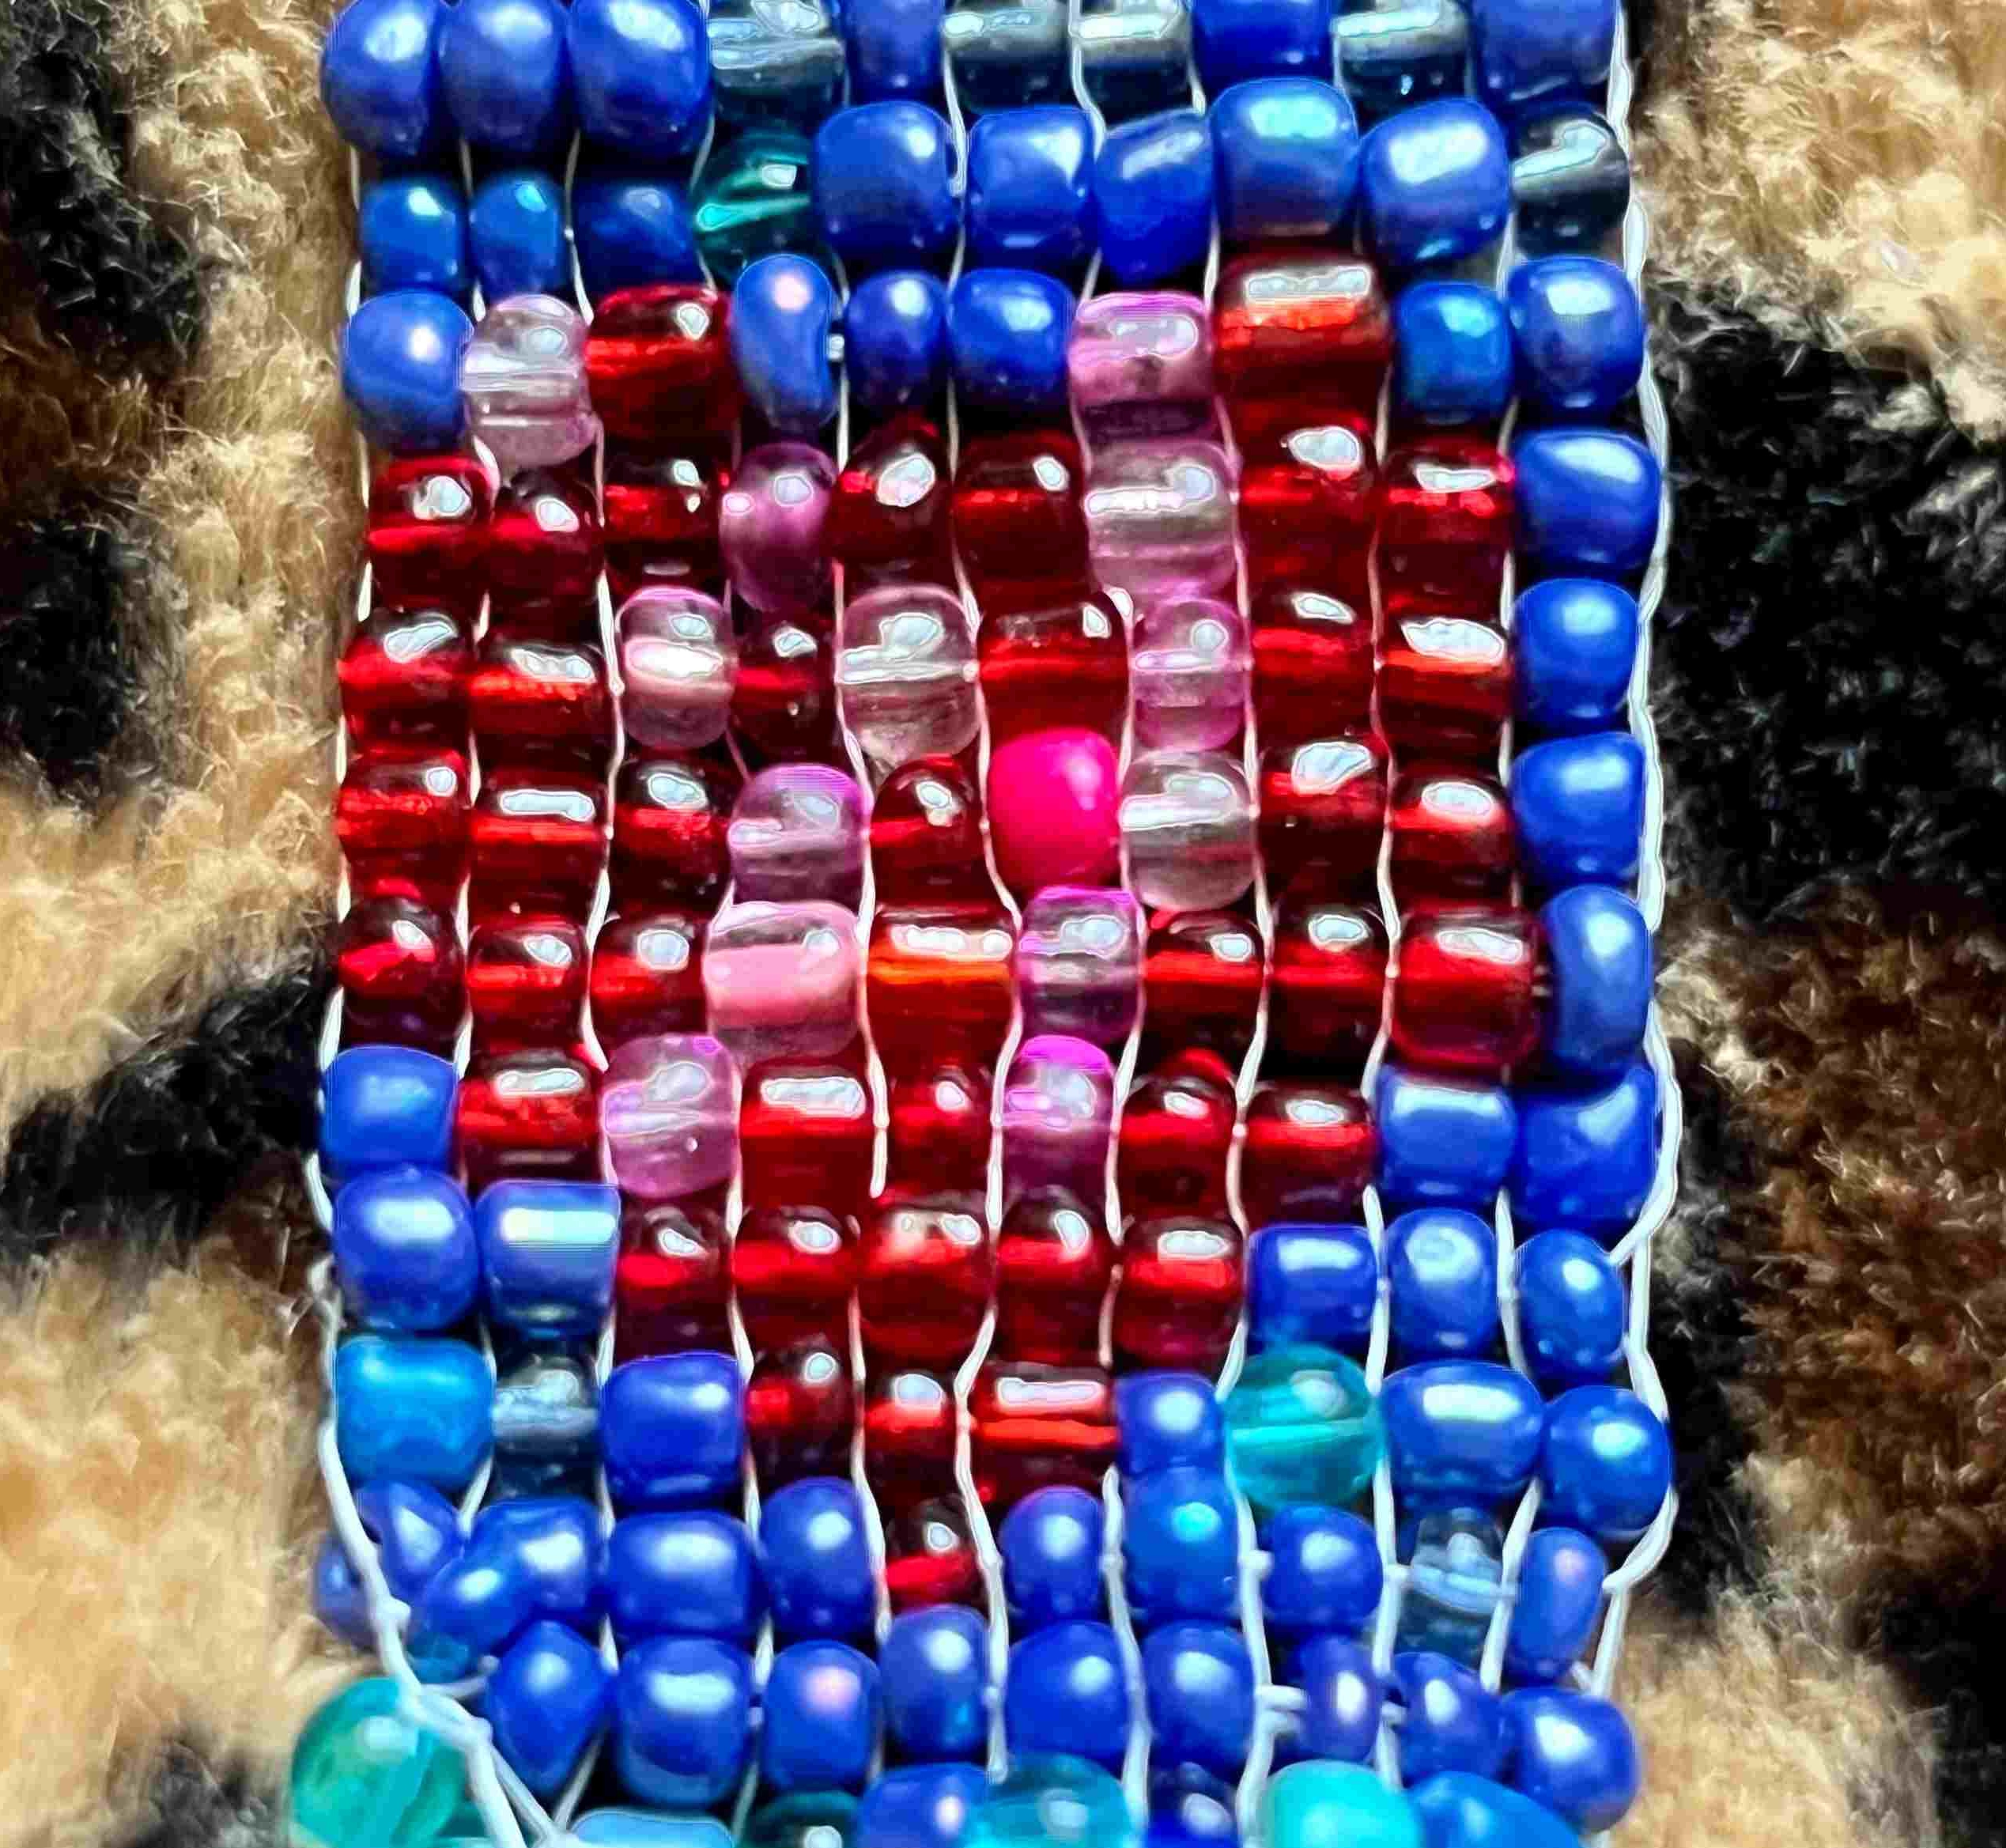
The patterns aren’t perfect, so I’ll be playing around with the code a little bit more, and also the beads I had didn’t color match exactly, but I see the vision…and I had fun.
- https://www.sciencedirect.com/science/article/pii/S0020025522014633
- https://www.ibm.com/think/topics/k-means-clustering
- thaura.ai
About k-means:
For coding help: